November 18, 2021
The College Dorm Anomaly
(adapted from two FB posts)
tl;dr: Population vax percentages count some people in different counties for the numerator and the denominator; jurisdictions with high proportions of college students in dorms are likely to have higher vax rates than reported.
If you're looking at vaccination rates at a local level, be very careful about what the data might be telling you. The Virginia dashboards have some nice visuals for demographic breakdowns and I went straight to our county stats:
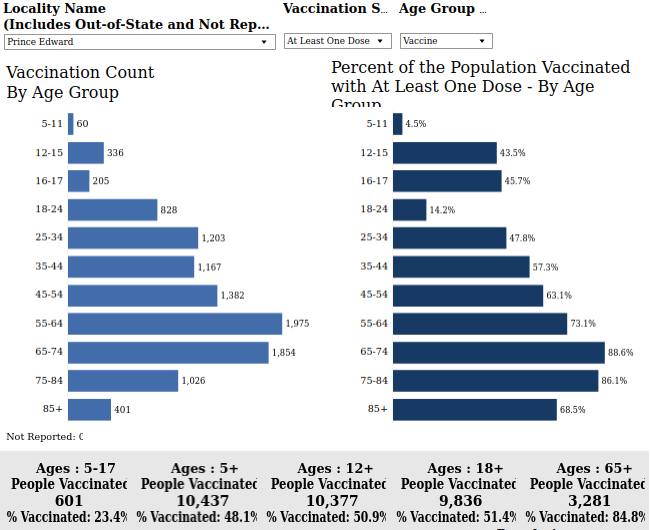
As soon as I saw that graph I knew what had happened: the vax percentages for the 18-24 age band are way low, because college students are counted in the denominator (presumably because the census counts college students in the dorms where they live) but not in the numerator (at least, not if they get vaxxed back at home, and maybe even if they get vaxxed here if data tracking is based on their "permanent address" or similar). Consider, by comparison, the same stats for Charlotte County, a nearby, mostly similar county that doesn't have two big colleges in the middle of it:
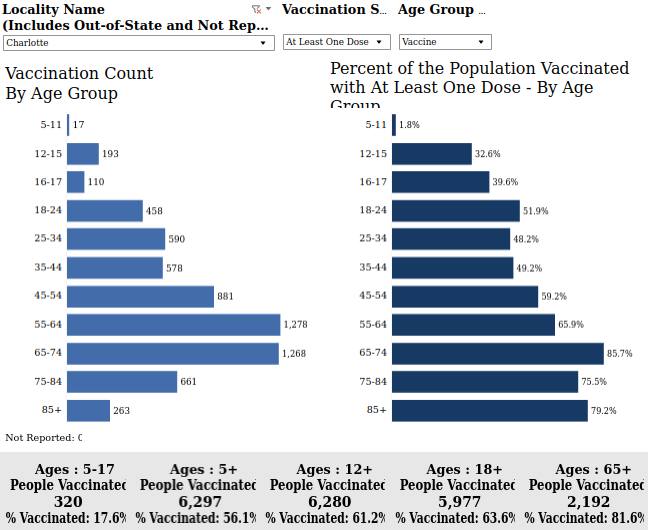
It's more what you'd expect: some variation and even trendlines by age band, but no outlier drop for the 18-24 band. (It's even a little bit high, which might reflect that college kids from Charlotte County that got vaxxed there are counted in the numerator but _not_ the denominator!)
We know from announcements by the two colleges that the actual student vaccination rate is in fact much higher than that of the overall county population. If you look at the percentages by age band, Prince Edward is comparable or higher than Charlotte in every other age band except 18-24 (and, oddly, 85+), but the reported summary stats show us as considerably worse, thanks to the College Dorm Anomaly. Looking at some other cities and counties around Virginia shows similar outlier-low percentages for the 18-24 band in other college areas such as Charlottesville (UVa), Montgomery County (Tech), Williamsburg (W&M).
So I ran the numbers, and if I'm right about this, the way these numbers are reported is really misleading. All analysis below is for Prince Edward County, Virginia, but will apply in any area with this kind of reporting that has a significant proportion of "temporary resident" college studentswhether or not they are explicitly reporting by age bands, it's just that the age bands make it easier to confirm this is happening.
To test my idea that the local vax rates might be a lot higher than officially reported (spoiler alert: they certainly seem to be!), I grabbed the vax counts and percentages from the site (and from those derived the total recorded population per age band) and came up with four models that measure and/or adjust for the college students that get mis-counted.
(Model 0: numbers as reported. Leads to an 18+ vax rate of 51.4% for the county, also matching reports.)
Model 1: ignore all 18-24 year olds! Exclude the 18-24 year olds from both the count of those vaccinated and from the total population.
Model 2: pretend 18-24 year olds are an average of 16-34 year olds. Both for estimating size of cohort (how many people in the age band) and for estimating vax behaviour (how many within this band are vaccinated), use an average of the 16-17 band and the 25-34 band. (Careful: the bands are different sizes! I accounted for this.)
Model 3: remove "non-counted college students" from the denominator. If their vaccinations wouldn't be reported in the numerator, then exclude them from the denominator as well. Challenge: how to know how many college students aren't counted? My initial plan was to estimate about 4500 (based on the size of the two colleges and a bit of guesswork regarding how many would count it as their residence), but see below.
Model 4: add the vaxxed college students to the numerator. Since they're actually here, might as well count them in our numbers, right? For the "non-counted" students (as in Model 3), we can assume that their vaccination behaviour matches that of the colleges specifically, and while I'm having a hard time tracking down current numbers on how many students at Longwood and H-SC are vaccinated, I'm remembering reported rates of 70% from earlier in the semester, so I'll use that for now. So, take 70% of the "non-counted" student number and add that into the vax count for the 18-24 band.
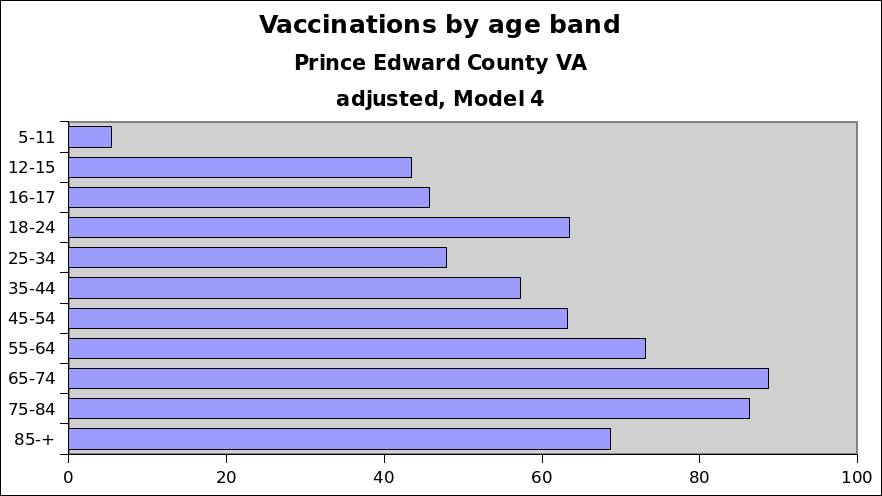
Under any of these models, the Prince Edward vax rate is something like 15 points higher than reported. Here is a side-by-side comparison of the age-band graphs for the numbers as reported, and for the numbers from Model 4:
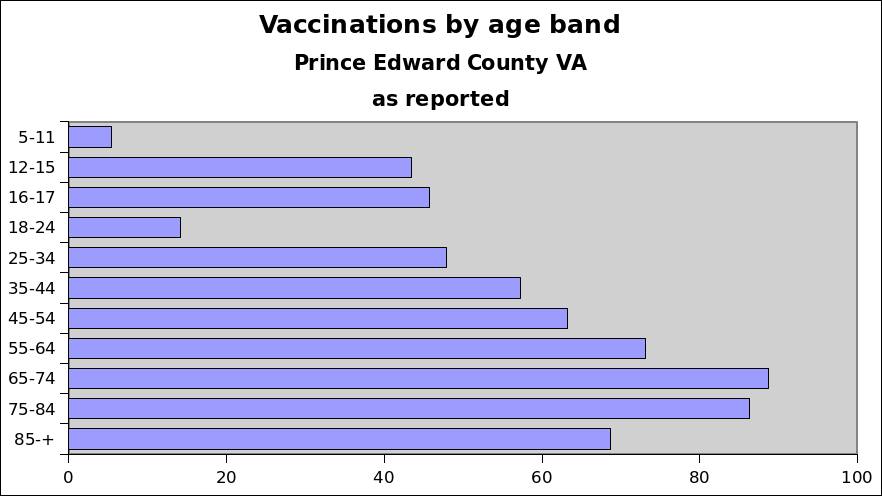
(M0: Reported 18+ vax rate: 51.4%.)
M1: This produces an 18+ vax rate of 67.7%! But that's probably a bit high, because we know that seniors are vaxxed at a higher-than-average rate.
M2: 18+ vax rate is 65.4%. But perhaps more importantly, this model also gives us a more direct estimate of "un-counted" students: since it provides a guess for how many 18-24 people we'd expect in the county, we can subtract that from the total reported 18-24 population to compute the "unexpected 18-24 year olds": 4122. This is quite close to my guess of 4500, so I used the computed number as the number of "un-counted" students in M3 and M4.
M3: 18+ vax rate is 65.5%.
M4: 18+ vax rate is 66.4%. A graph of the adjusted age band percentages is also shown below; again, this is assuming a 70% vaccination rate for the unexpected/uncounted 18-24 year olds. The model is somewhat sensitive to minor variations in the size of that group (e.g. 4122 vs 4500) but more sensitive to variation in the rate of vaccination in that group (e.g. 70 vs 80); but it seems like all reasonable numbers for those put the resulting 18+ vax rate in the high 60s, as in the other models.
So regardless of which of those models you find most persuasive, I think we can conclude that the Prince Edward numbers, rather than being at the low end of the state with 51.4% for 18%, are a lot closer to the middle at 65-67%. That's still low for the state overall (which is reporting 80% for 18+) but relatively high for the rural counties and definitely higher than any of our neighbouring counties. To believe that PE's numbers are 51.4 you would have to believe that 18-24 year olds in our county have massively different behaviour than people slightly younger or slightly older, and different than 18-24 year olds in all the nearby counties! AND ALSO you'd have to believe that the colleges were lying about their students' vaccination rates. So I'm extremely comfortable in concluding that the 18+ rate here is about 66% or so right now.
I'm sure the phenomenon is not unique to Virginia, of course; if you're looking at county- or town-level vaccination data in your area, try to get your hands on age-band data if it's available, or at least make a mental note about this possible limitation of the data reporting. If you're making decisions on where to go or how to act when you're out, you should do so in light of the real numbers, not the anomalous ones.
"Without teachers, humankind would be sitting in a cold, dark, clammy cave, picking nits and wondering how Grandfather started his legendary fire." --Elle Newmark, The book of unholy mischief
Comments on Facebook
Posted
by blahedo
at 11:15am
on 18 Nov 2021